Sluggish and under-performing websites will never attract an audience. Beyond that, although your website might work at lightning speed during testing, do you know how it will perform when there’s a sudden traffic surge? Or if your business had a growth spurt which requires additional integrations and functionalities?
What you’re looking for is a way to test your website’s performance in various scenarios. And that’s where Performance testing steps in. The main goal of performance testing is to make sure that the website’s performance is as expected before it is released onto the market. It helps test for speed, reliability, response time and resource usage. A fantastic open source tool for all that performance testing is JMeter. Take a deeper look into JMeter and find out how you can implement a test in this article.
Why Performance Testing
The goal of the performance testing is not to find bugs but to eliminate performance glitches. Without conducting a thorough performance testing, the website might suffer from issues like running slow while several users use it simultaneously, or poor usability. One of the most significant reasons for performance testing is to avoid downtime.
Did you know that about 59% of fortune 500 companies run into around 1.6 hours of downtime every week? A 5 minute downtime back in 2013 cost Google.com a whopping $545,000! An unexpected web service outage cost Amazon a loss of $1100 per second. Source.
All of this can be avoided if a performance test can simulate heavy load on servers, can run functional testing, application testing and protocol testing.
Performance testing using JMeter
The Apache JMeter application is an open source software, an application purely based on Java, designed to test load or performance testing. It was first designed by Stefano Mazzocchi of the Apache Software Foundation. JMeter can simulate a heavy load on a server by creating tons of virtual concurrent users to the web server.
How does JMeter perform testing
JMeter creates a request and sends it to the server. Once it receives the server request, it collects them and visualizes those details in a chart or graph. Then, it processes the server request and finally generates the test result in several formats such as text, XML, JSON. From the gathered data, users can observe the application’s behavior and performance bottlenecks, offering insight into where the application needs improvements.
Why JMeter
- Open source - JMeter is an open source software and can be downloaded free of cost
- Platform independent - JMeter is developed in Java, which is the most popular programming language in the world. Therefore, it can run on any Operating System.
- Multi Protocol Support- JMeter does not only support web application testing but also evaluates database server performance. All the basic protocols such as HTTP, JDBC, LDAP, SOAP, JMS, and FTP are supported by JMeter.
- User-friendly - JMeter has a comprehensive GUI, which helps to create test plans and configure the elements. Adding elements is also easy. You just have to right-click on the test plan and add what you need to do.
Elements of JMeter
- Thread Group - Thread Group is a collection of Threads. Each thread represents one user using the AUT. Each Thread imitates one real user request to the server.
- Samplers - JMeter supports testing HTTP, FTP, JDBC and many more protocols. Thread Groups simulate user requests to the server. It helps the Thread Group to know what type of requests (HTTP, FTP etc.) it needs to make.
- Listeners - Listeners facilitate viewers to view Samplers result in the form of tables, graphs, trees or simple text in some log files.
- Configuration - Config elements in JMeter are used to configure or modify the sampler requests made to the server.
How to install jmeter
There is just one prerequisite for downloading and installing JMeter: to have Java installed in your system.
- Download JMeter and install from here - https://jmeter.apache.org/download_jmeter.cgi
- To Launch JMeter: Apache jmeter folder > bin folder > click jmeter.bat
Create a Test Plan
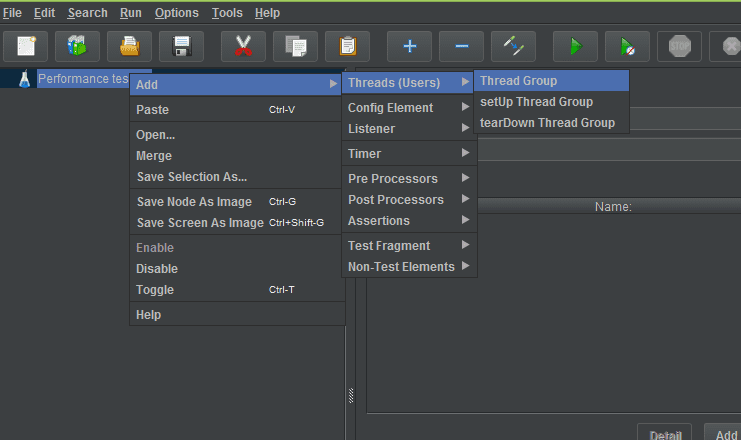
Step 1: Add a thread group
Go to add, then Threads(Users) and select Thread users.
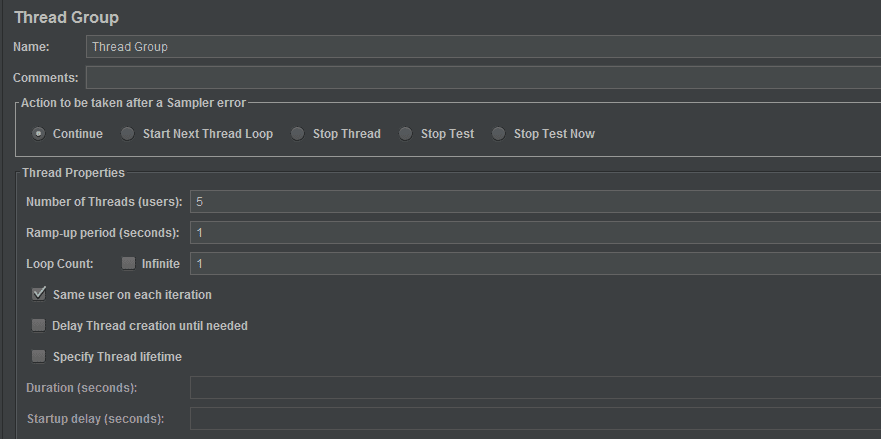
Options
A. Action to be taken after there is an error
B. Number of threads - No. of users
C. Ramp-up period in seconds - Time gap between the users' hits
D. Loop count - How many times the test will run for the number of users
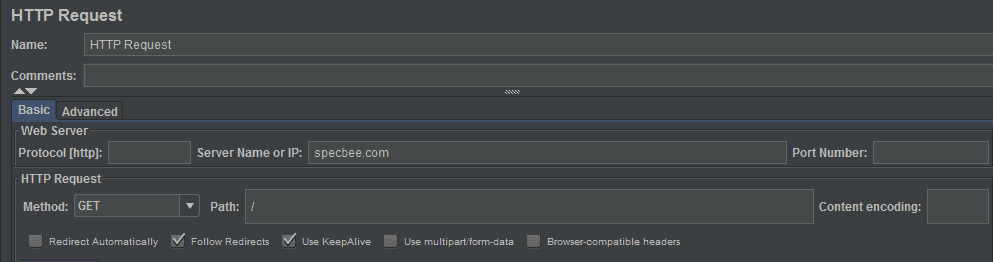
Step 2: Add HTTP Request
Right click on the Thread group , add a sampler and click on Http request.
Options
A. Add “Server name”
B. Don't give http or HTTPS since these are protocols that will come in the other box and that will be automatically taken in the http request case.
C. Path dialog box → add forward slash.
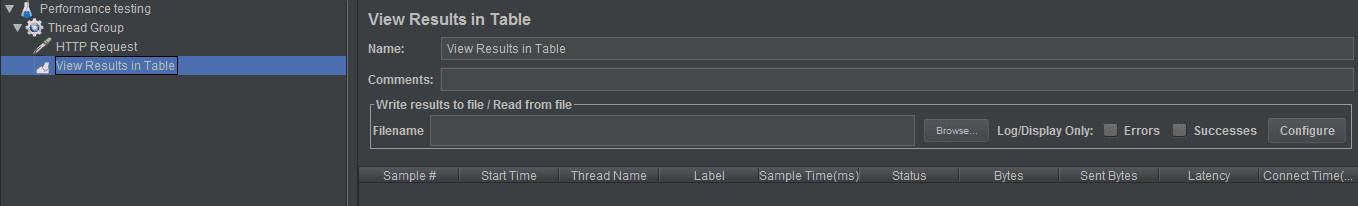
Step 3: Add Listener
Right click on the Thread group , add a Listener and click View result in Table.
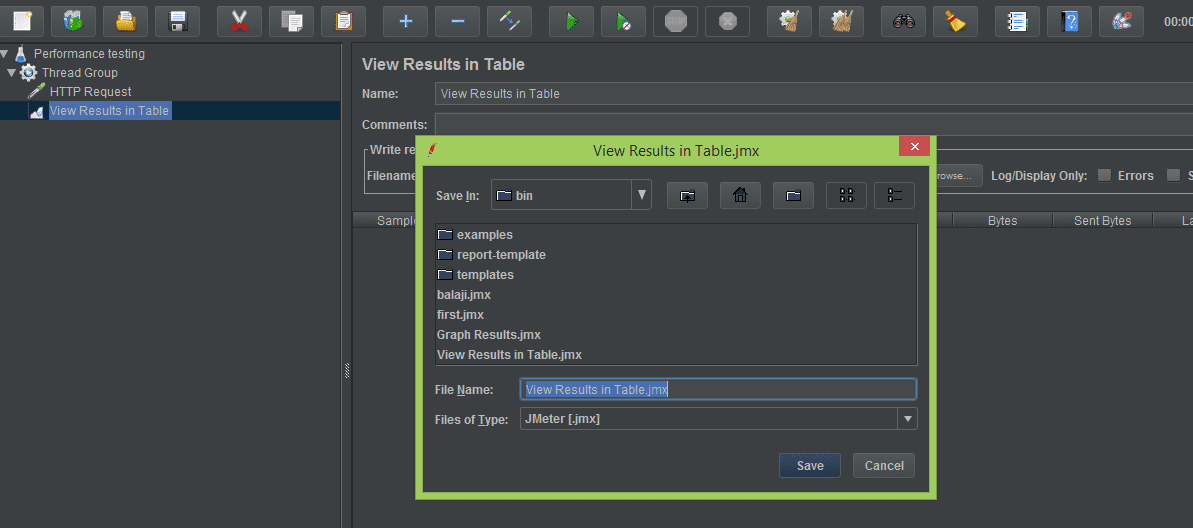
Step 4: Running the Test
Save the test and click on the green arrow button.
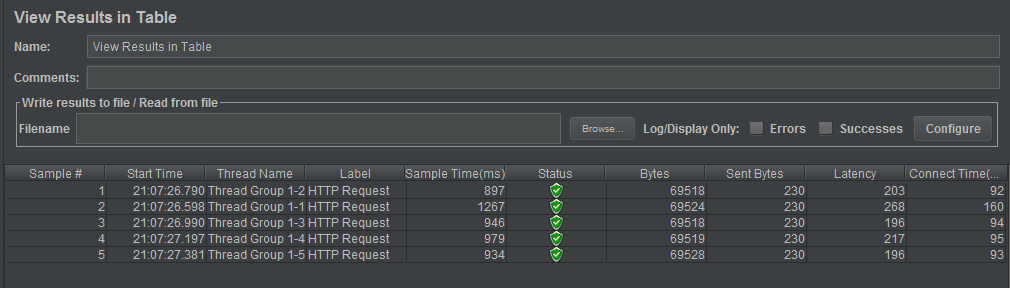
Time to Analyze the Result
- Sample number - The no. of threads or users. In the report it will mention that “this is sample number 1”, which means it is thread 1, then thread number 2 and so on.
- Start time - Start time for each thread or user
- Thread name - Thread name is basically thread group name here. In the thread group name we have this number 1-1 , 1-2… so this first one means first iteration with first user , first iteration with second user and so on.
- Label - Label is your sample or request name.
- Sample time - How much this sample(label) took time in terms of a m/s.
- Status - Status of the request.
- Bytes- Received bytes
- Sent bytes - Bytes that were sent
- Latency - A time request from the user/browser and the response time. Response in terms of request traveled from server to the client / browser which doesn't include the server processing time. (request and response time only)
- Connect time - Connection time is how long your application took to get connected to the server in milliseconds.
It is important to know that Latency and Connect time should always be low. A higher connection time or latency implies that there is a problem with the website’s performance.

Tanuja
Related Insights


Don't Miss Out!