Fun fact: The world's first computer bug was a real moth! But don't worry, we're not here to debug insects. We all know that debugging is vital in website development. It helps developers identify and resolve issues, leading to a smoother and more reliable end product. To achieve that, you need the right tools. One such technique that can help you troubleshoot your PHP is XDebug.
In this article, I’d like to share the steps and requirements involved in setting up PHP debugging with XDebug on Lando and DDEV Drupal setups using the VS Code IDE. Let’s dive in!
What is XDebug
Xdebug is a standard and powerful debugger in PHP and improves your development experience. It provides us developers with key features that help in finding and fixing the errors in code.
- Step Debugging - A way to step through your code in your editor while the script is executing.
- Improvements to PHP's error reporting - This allows you to get better error messages and obtain more information from PHP's built-in functions. An upgraded var_dump() function, stack traces for Notices, Warnings, Errors, and Exceptions to highlight the code path to the error.
- Tracing - When an error occurs, Xdebug generates detailed stack traces that show the sequence of function calls leading up to the error, helping developers pinpoint the source of the issue. Xdebug helps in tracking the values of variables during script execution, making it easier to understand how values change as the script progresses.
- Profiling - With the help of visualization tools, it allows you to analyze the performance of your PHP application and identify bottlenecks.
- Code Coverage Analysis - This can generate code coverage reports, to show which parts of your code base are executed when running unit tests with PHPUnit.
- Support for Various IDEs - Xdebug supports integration with multiple IDEs such as PhpStorm, Visual Studio Code, Eclipse, NetBeans, and more.
XDebug with VS Code IDE
I chose VS Code here as it's one of the most used and my favorite editor. Install Visual Studio Code (VS Code) if you haven't already.
To make Xdebug work on this IDE, the first thing you need is the ‘PHP Debug’ Extension. Find and install it. This is needed for projects running on Lando or even with DDEV.
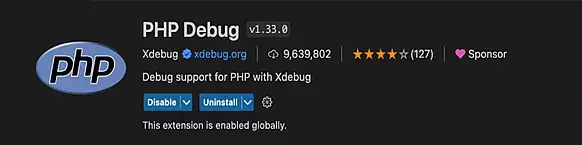
PHP Debug Extension
XDebug + VS Code + Lando
Enabling Xdebug on Lando
Lando by default does not provide you with an Xdebug extension. To enable Xdebug on Lando add the xdebug: true line to your .lando.yml file under the config key:
name: TechX
recipe: drupal10
config:
 xdebug: true
Or else, override your php service, by adding xdebug: true under appserver:
name: TechX
services:
 appserver:
   webroot: web
   xdebug: true
Follow it up by rebuilding your environment:
lando rebuild -y
This will enable the extension by default whenever you start the Lando environment and Xdebug is now ready to receive the connections.
In terms of performance, an even better option is to toggle between Xdebug on and off with some custom tooling commands. If you're using Apache, tweak your .lando.yml with the following lines and don’t forget to run lando rebuild -y after.
config:
 # Set Xdebug off by default. We use the tooling below to turn it on as needed.
 xdebug: false
services:
 appserver:
   overrides:
     environment:
       XDEBUG_MODE: 'debug,develop'
tooling:
 xdebug-on:
   service: appserver
   description: Enable Xdebug.
   user: root
   cmd:
     - docker-php-ext-enable xdebug && kill -USR2 $(pgrep -o php-fpm) > /dev/null || /etc/init.d/apache2 reload
     - tput setaf 2 && echo "Xdebug On" && tput sgr 0 && echo
 xdebug-off:
   service: appserver
   description: Disable Xdebug.
   user: root
   cmd:
     - rm /usr/local/etc/php/conf.d/docker-php-ext-xdebug.ini && kill -USR2 $(pgrep -o php-fpm) > /dev/null || /etc/init.d/apache2 reload
     - tput setaf 1 && echo "Xdebug Off" && tput sgr 0 && echo
Now you can enable and disable Xdebug with custom commands lando xdebug-on and lando xdebug-off.
Browser Requirements
For your browser, install the suitable Xdebug helper extension.
On Chrome browsers, enable the Xdebug helper extension.
Xdebug helper - Chrome Extension
If you are using Firefox, try the Xdebug Helper add-on.
Xdebug helper - Firefox Add-On
Making Xdebug work on VS Code
The next step is to create a custom .vscode/launch.json file within your workspace. This will map paths so that XDebug works correctly.
Open your project in the VS Code IDE, go to ‘Run and Debug’ and click on ‘create a launch.json file’
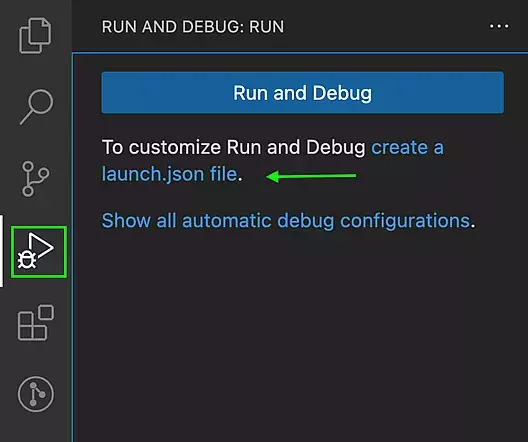
Create launch.json file
This will create the launch.json file with relevant configurations. Update the ‘Listen for Xdebug’ section with the below details. Note that the Xdebug 3 listens on port 9003.
{
 "version": "0.2.0",
 "configurations": [
   {
     "name": "Listen for XDebug",
     "type": "php",
     "request": "launch",
     "port": 9003,
     "pathMappings": {
       "/app/": "${workspaceFolder}/",
     }
   }
 ]
}
Start debugging!
Add a debug breakpoint to a line in your PHP code wherever you need it by clicking the line number.
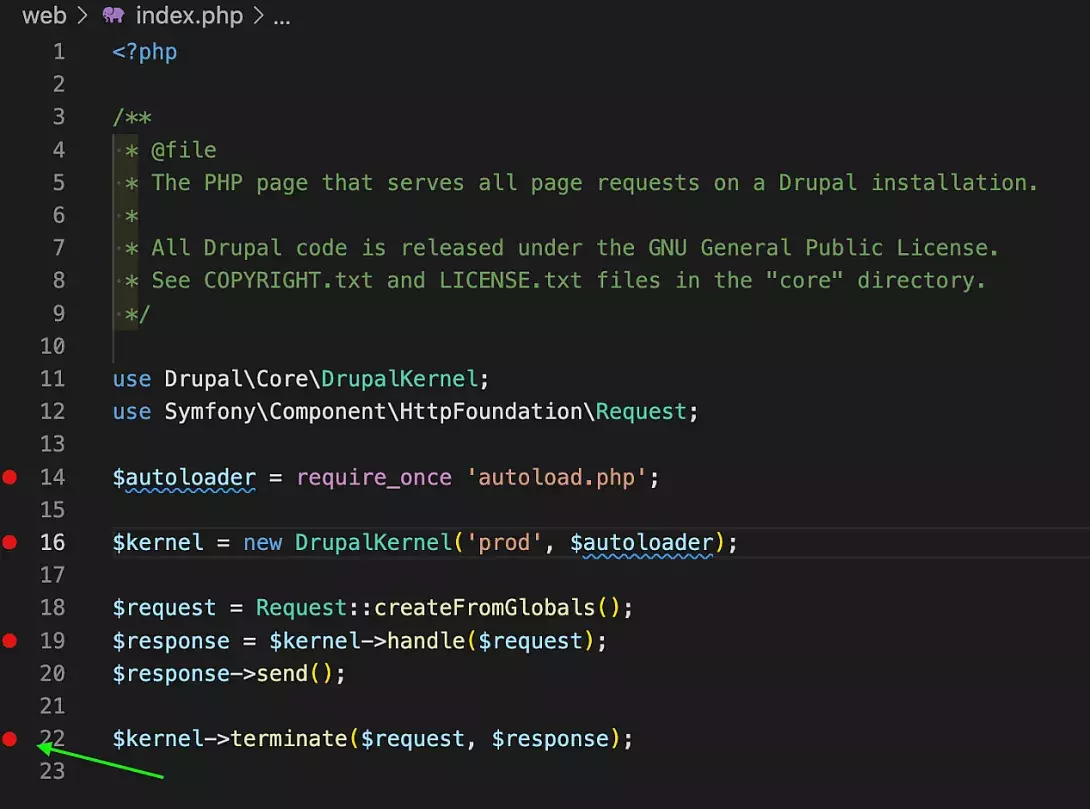
Set breakpoints
Enable Xdebug on Lando using:
lando xdebug-onIn the menu, click on Run → Start Debugging. Ensure “Listen for Xdebug” is selected by the green arrowhead at the top left. The bottom pane of VS Code will be changed to orange (live) and should say “Listen for Xdebug”.
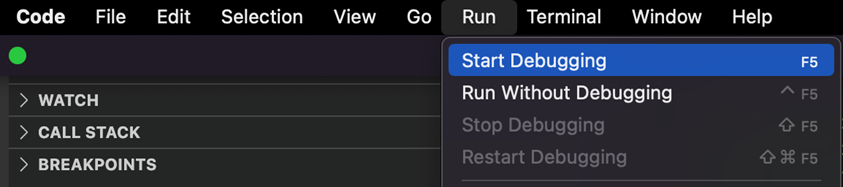
Start Debugging
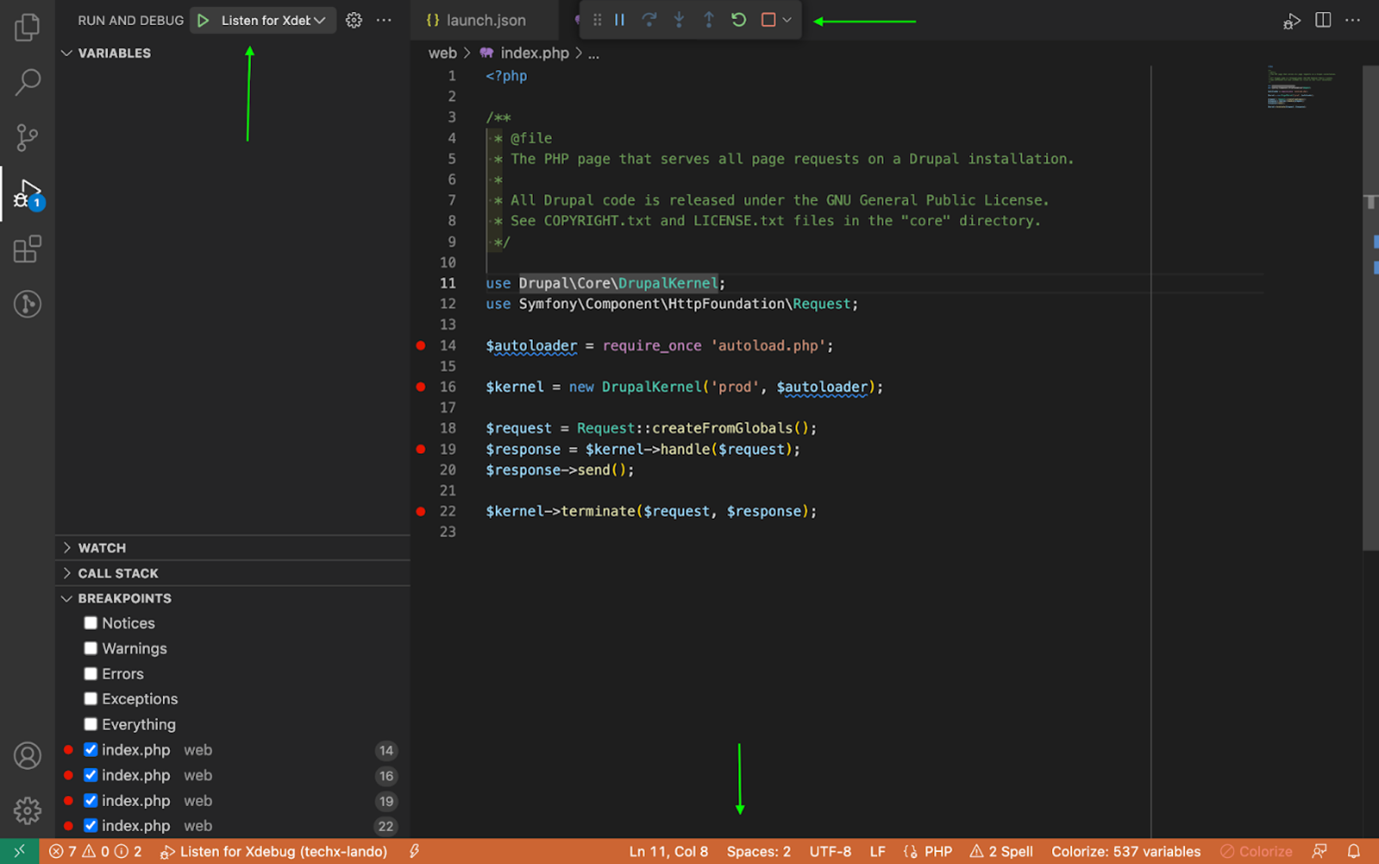
Start Debugging
In your browser, navigate to your Lando app's URL and find the Xdebug helper extension in the address bar. It is usually a "beetle" icon. Click on it and choose "Debug" from the menu to tell your browser to send the appropriate parameters to Xdebug so that Xdebug activates when a request is made.
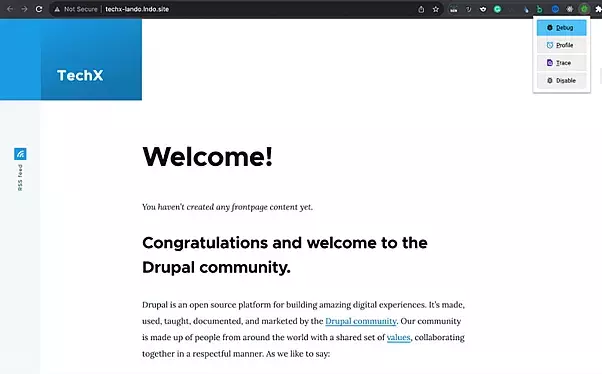
Enable Xdebug helper extension
Refresh the page or click on your site link. VS Code should now automatically open the Debug window and produce a debug output if a breakpoint is reached.
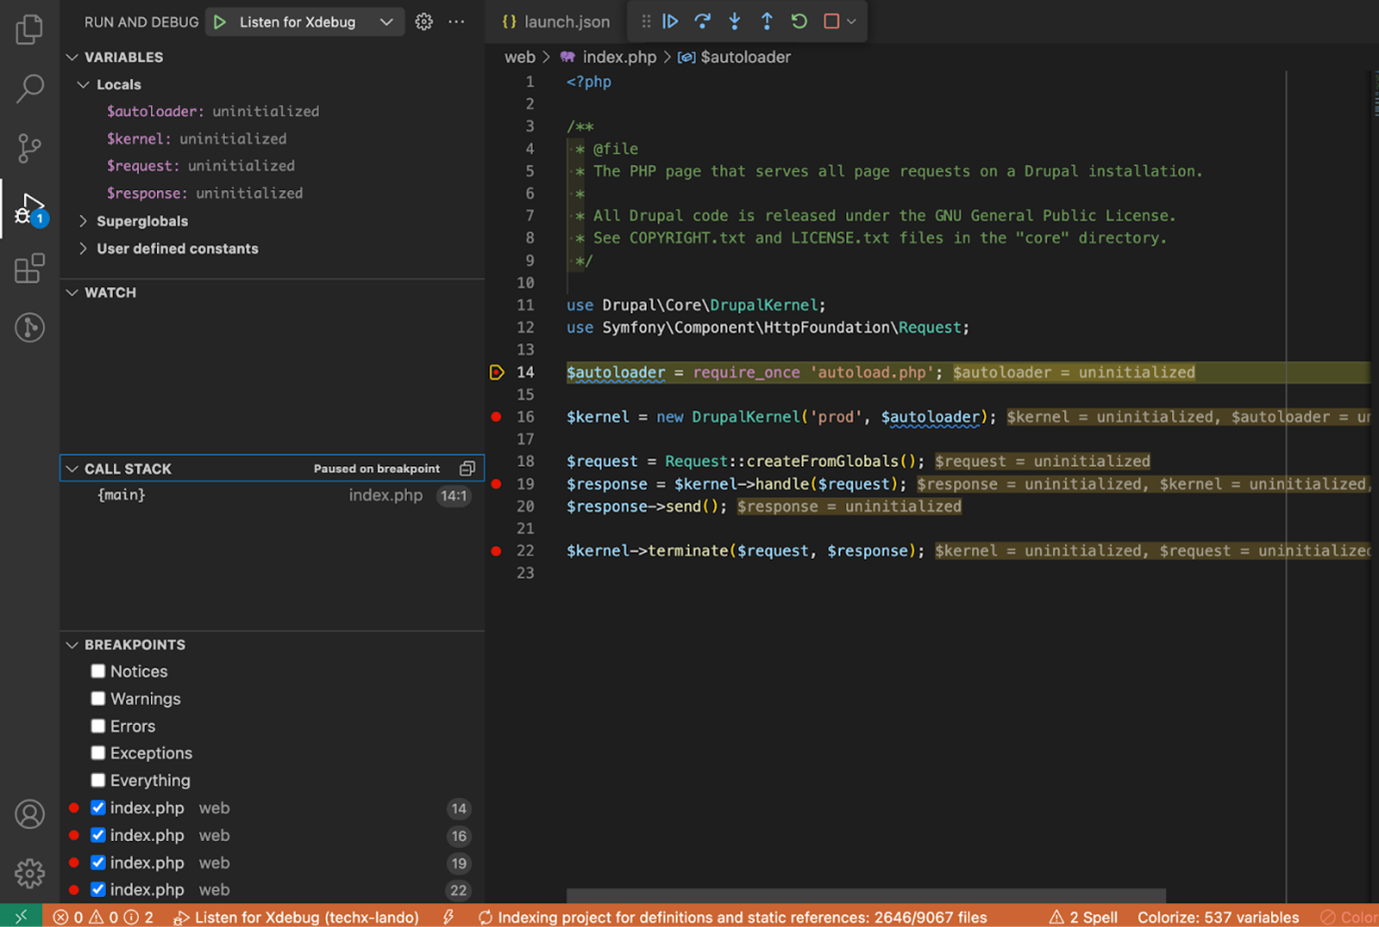
Xdebug in action
Debugging Process
When your code execution reaches a breakpoint, the debugger will stop, and you can inspect variables, step through code, and understand the flow. VS Code will provide a user interface for interacting with the debugging session.
XDebug + VS Code + DDEV
Unlike Lando, with DDEV, Xdebug already exits out of the box. You don't need any custom service, no rebuild, no browser extensions, no Drama! :)
Just update the project’s .vscode/launch.json to add the “Listen for Xdebug” configuration from the below-attached config snippet.
{
 "version": "0.2.0",
 "configurations": [
   {
     "name": "Listen for XDebug",
     "type": "php",
     "request": "launch",
     "hostname": "0.0.0.0",
     "port": 9003,
     "pathMappings": {
       "/var/www/html": "${workspaceFolder}/",
     }
   }
 ]
}
Set a breakpoint in your PDP code. Restart it, if the breakpoint you set isn’t solid red.
In the menu, choose Run → Start Debugging and ensure “Listen for Xdebug” is selected.
Enable Xdebug on DDEV using:
ddev xdebug onIn a browser, visit your project, and just like you saw earlier, you will be redirected to your IDE once you hit the breakpoint.
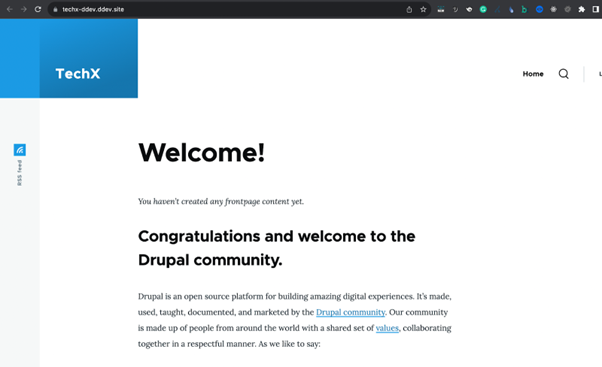
Visit the page
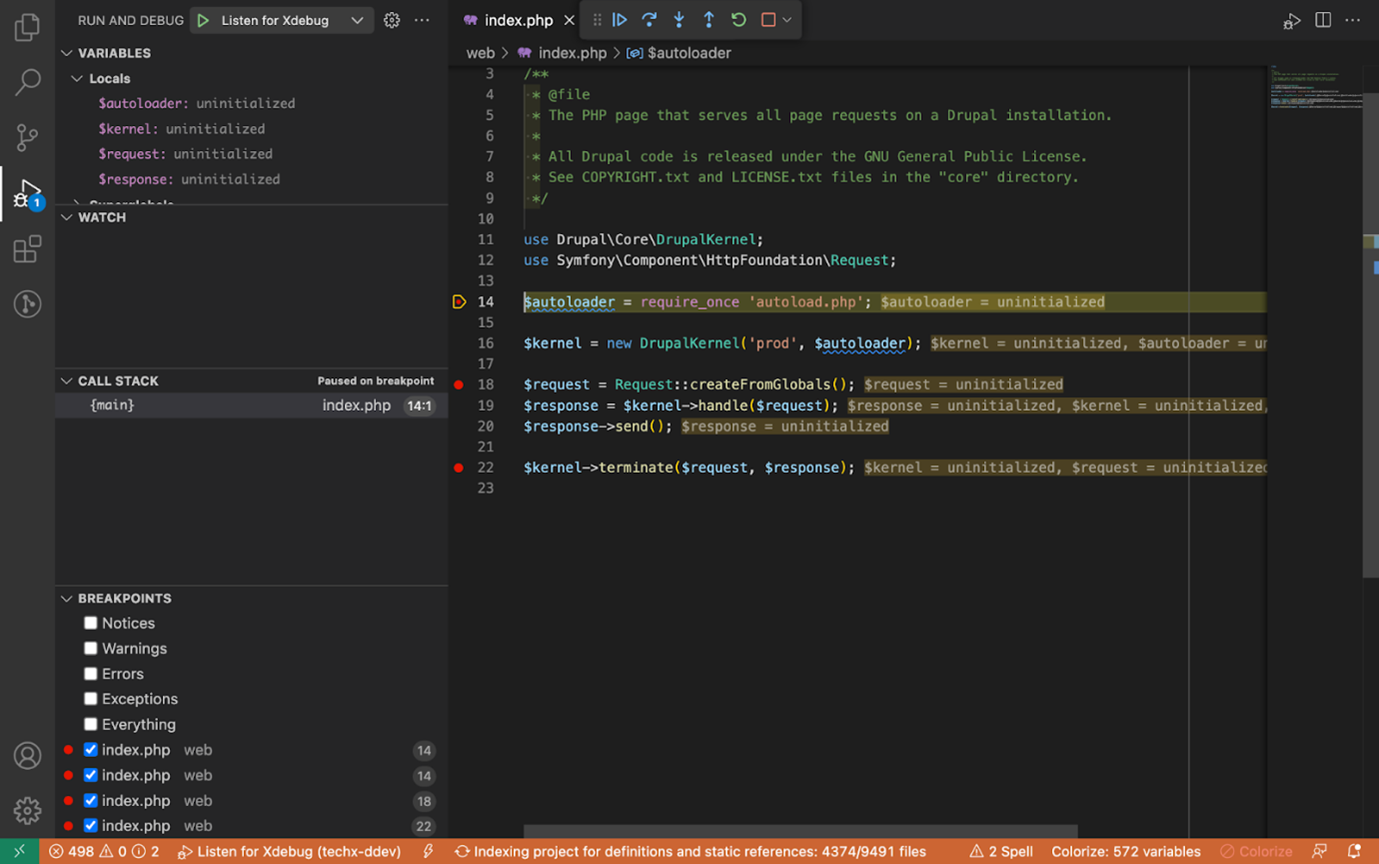
Will be redirected to the IDE and stop at the first breakpoint
Final thoughts
XDebug is a powerful tool that significantly simplifies the debugging process for Drupal developers, helping them write more reliable and efficient code. I hope this tutorial has shed light on its benefits and how to set it up in your development environment. If you found this article useful, consider subscribing to our weekly newsletter where we share the latest tips, tricks, and insights in Drupal development.

Ankitha Shetty
Related Insights

Don't Miss Out!