Table of contents
- Drupal Google Analytics - Setup and Installation :
- 1. Create a New Google Analytics Account or Use Your Existing Account to login:
- 2. Integrate Google Analytics with Drupal website:
- Features of the Drupal Google Analytics Module
- Why Go Custom Google Analytics Report?
- Building Your Custom Google Analytics Report

Once you have a well-built Drupal site up and running, ask any website administrator and everyone wants to know more about the visitors to their site, their behaviour and how the website is performing. This information is a solid indicator of the popularity of the website among the people and the search engines as well. Using Drupal google analytics will be the perfect choice for gathering all this informative data.
When we talk about this data or analytics as the marketers call it, there is one tool which stands tall and wears a crown - Google Analytics. With detailed information on the number of visitors, including where they came from and how much time are they spending on the site, Google analytics reports provides real-time updates. In Drupal, the Drupal Google Analytics module used by almost 400,000 sites, is among the top 20 most popular modules. The google analytics integration with Drupal allows the use and customization of numerous features to change things up from the usual pattern.
Drupal Google Analytics - Setup and Installation :
1. Create a New Google Analytics Account or Use Your Existing Account to login:
The first step to google analytics integration with Drupal 8 is to add your Drupal website into your Google Analytics (assuming you already have a Google Analytics account). Login to your Google Analytics account and navigate to the "Admin" panel to add a new account. After filling in the required details click on the "Get Tracking ID" button to receive the ID and the script to be embedded into your Drupal website.
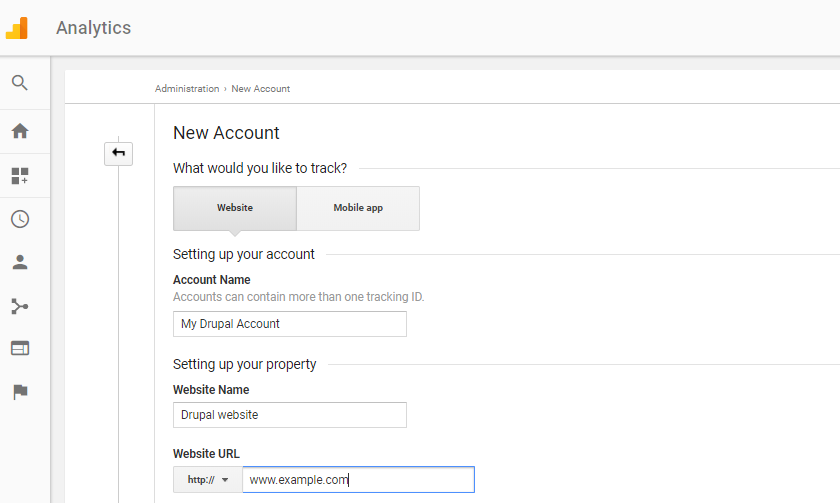
Google Analytics New Account
2. Integrate Google Analytics with Drupal website:
Once done with adding the account, login to your Drupal website and go to the Drupal Google Analytics Module page to install and enable the same. Know the version of your website and select the same version of the module. Now get the "Tracking ID" from Google Analytics and paste it in your Drupal site. To do that, go back to your Drupal site, navigate to Configuration-> Google Analytics. Paste the ID in the field of "Web Property ID". The Drupal Google Analytics setup is complete.
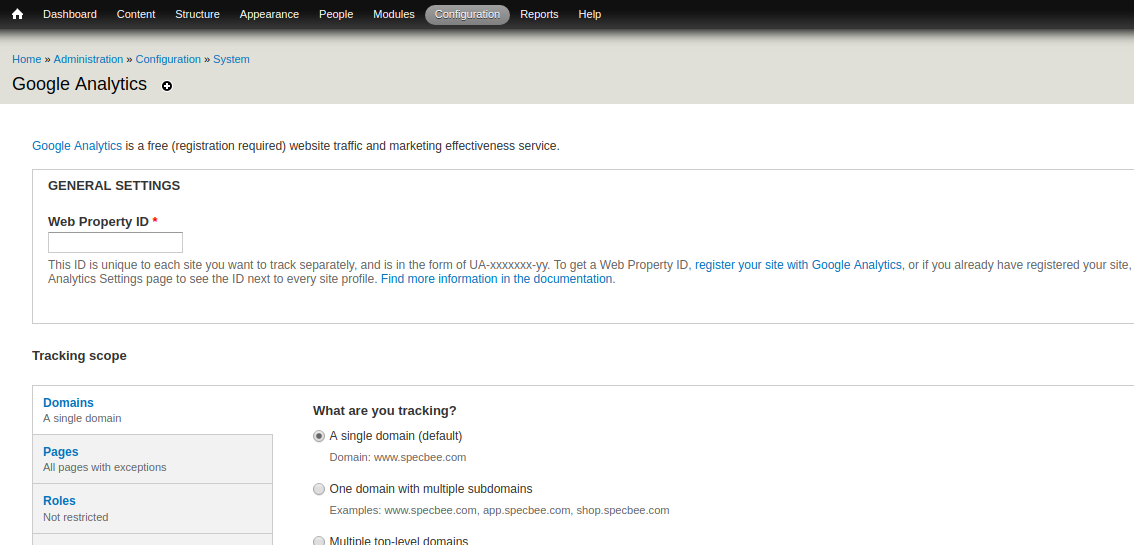
Google Analytics Tracking ID
While the real power of Drupal Google Analytics lies in the data it provides, it can sometimes be quite overwhelming. So much data at one place and the application developers keep on adding on more and more analytics where sometimes all we need is a simple report or a more specific one. After months of scrutinizing data, I had enough of it and I finally worked up the nerve to switch over to custom reports. Oh Boy I was in for some great features and lot more!
Features of the Drupal Google Analytics Module
Now that you have successfully completed setting up and configuring google analytics with Drupal 8, let's learn more about the features offered by the Drupal google analytics module. The Drupal Google Analytics Module supports Drupal 8 as well as Drupal 9 websites. With Drupal analytics, you can track single and multiple domains. You can easily select the web pages or user roles you want to track. The module also enables you to monitor the links that are being tracked and files that are being downloaded from the tracked web pages. Web developers can also write custom dimensions and metrics and send custom data to Google analytics. The Drupal google analytics module also supports website search, ad sense and remarketing. In addition to all these amazing features, if you are looking to generate reports for your Drupal website's tracking data, you can integrate the Drupal Google Analytics Reports module with your website.
Why Go Custom Google Analytics Report?
Because I'm in love with it! Simply put, why bother or scratch your head over the standard Google Analytics reports and scrutinize for the information you require, when you can create reports that contain just those exact information?
While "what" custom reports should you create is a big question in mind, you should know that these reports are, well, "CUSTOM" and are specific to business needs and requirements.
Before we jump right into the reports, let us go over the two main concepts to keep in mind while creating a Google analytics custom report.
- Dimensions: Characteristics of visitors on your site. For example Source, Country, Device etc.
- Metrics: A qualitative measurement of visitor interaction on your site. For example Pageviews, Bounce Rate, Unique Purchases etc.
Building Your Custom Google Analytics Report
To begin with, log into your Google Analytics account and navigate to customization. Click the "New Custom Report" to start building the report you require.
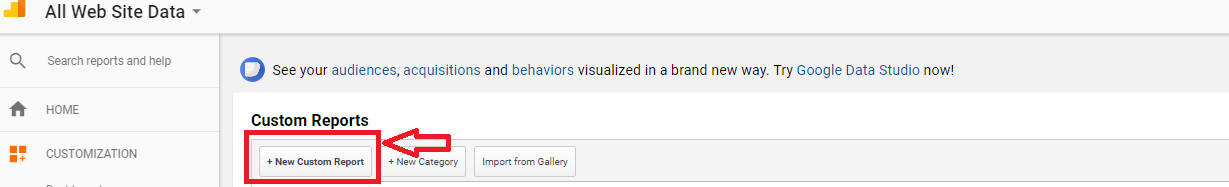
New Custom Report
The first thing you will do is to name your custom report, which is pretty straightforward using the "Title" field.
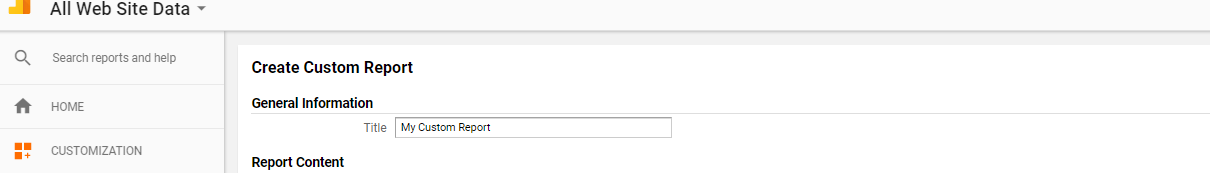
Custom Report - Title
Next up, you have the report tab which allows you to create more than one tabs of data in a single report which allows you to breakdown your Google Analytics report into smaller chunks. Once you have decided on the number of tabs to use, you need to select your report type. There are three options to pick from, Explorer, Flat and Overlay. Explorer reports are similar in layout to the older version of Google Analytics with a trend chart and some data tables. On the other hand, "Flat Table" is a basic table report that allows you to analyze two dimensions side-by-side. "Map Overlay" can be used for precise location-based data or stats.
The Metric groups and dimension drill down allows you to select what data you want in your report and how you want this data to be further broken down. Google analytics allows a maximum of 25 metrics to be included in a flat table report and the metrics selected here will the appear as data columns on the final custom report. The metrics can be anything from visits, average time per visit & bounce rates to something more specific like conversions to goal completions.
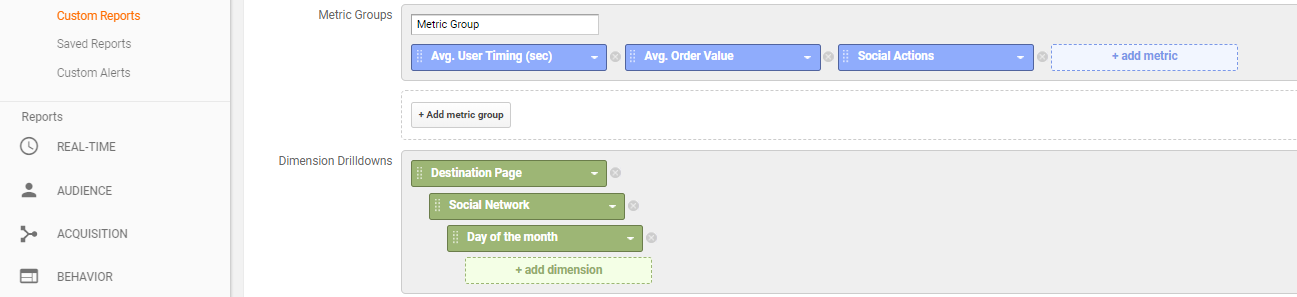
Google Analytics - Metrics & Dimensions
The dimension drill down in the form of individual rows in the final ga report allows you to organize your metrics and further break down your report data.
When you get to "Filters" this allows you to limit your final report and let Google know which data set you want to include. For example if you create a Google Analytics report with the country dimension, you can add a filter to show up data from certain countries only. All you have to do is use "Include" with "Exact Match" of the country you desire.
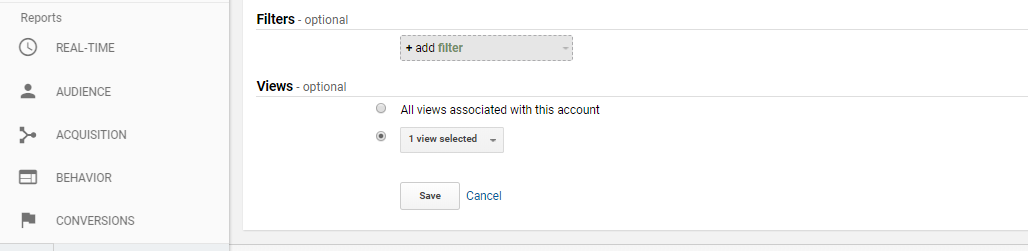
Filters
Now that you have your Google Analytics report for your Drupal 8 website, it is time to review your "masterpiece" and start analyzing the data.

Shri Ganesh Hegde
Related Insights


Don't Miss Out!