Debugging is not something us developers look forward to. Developers detest bugs but to be able to build a fine quality software, debugging is an indispensable part of a developer’s life. Every PHP developer has a different style and go-to methods for debugging their code. This depends on their experience, their problem-solving approach and most importantly - the amount of time they have in hand!
How important is debugging and why do you need to debug your code?
Debugging is an integral part of a software development life cycle that assures quality results.
Picture this - The codebase is big, You are new to the project, You do not have much details of the project/functionality. But you are supposed to fix a bug. Where do we start from? We start by analyzing the code step by step to understand what is done and where things are going wrong. That, my friends, is Debugging. Debugging is an art that can get better with practice and experience.
How to debug your PHP code
Okay so here is a case that I have come across in my development career. There is a commerce site built on Wordpress in which the checkout process was taking around 5-8 minutes and I was asked to solve it. In this case, I don’t have much knowledge on how things work with Wordpress. So I started with checking off the options from the list one by one such as, (a) Is it because of some plugin? (b) Is it Theme related? (c) Is it any custom code base? etc.
The tool that helped me in php debugging and solving this case is Blackfire. This gives you a more user-readable option of the stack trace of all the functions, the time taken for each function in the whole process. By using this, I found the function that is eating up the checkout process. All you need is some setup to add the key to your code base and you are all set to analyse any functionality using the documentation.
So, you can solve the bugs if you have knowledge on multiple methods of php debugging.
Code Debugging Techniques
Let me talk about a few techniques that I have used for debugging PHP.
A simple and most common way to check if the function or the method you have written is being called up, write an exit. There wouldn’t be any developer who hasn’t used this!
To check the value of some variable, print_r(), var_dump(), var_export(). Okay, let’s see the difference.
Example:
Assume an array
$a = array( 1, array( "a", "b") );
print_r($a);
Array
(
    [0] => 1
    [1] => Array
        (
            [0] => 'a'
            [1] => 'b'
        )
) |
This gives a human-readable format and information about the variable. Also, we can store it to a variable with print_r($var, true).
var_dump( $a );
array(3) {
  [0]=>
  int(1)
  [1]=>
  array(2) {
    [0]=>
    string(1) "a"
    [1]=>
    string(1) "b"
  }
} |
This prints along with type, length of each value. And this is faster comparatively to print_r()
var_export( $a );
array (
  0 => 1,
  1 =>
  array (
    0 => 'a',
    1 => 'b',
  ),
) |
This prints along with type, length of each value. And this is faster comparatively to print_r()
var_export( $a );
This returns valid php, if variable exists, else returns false. Which means, the output of var_export can be used directly in a php file.
Have you ever made use of debug($var, NULL, TRUE) provided by Drupal core? This uses print_r() or var_export based on the arguments passed to the php debug function.
What about the warnings like below, which you don’t have a clue on which line of code is causing such a warning.
warning: Invalid argument supplied for foreach() in /modules/node/node.module on line 485.
We know that there are so many places that the node module will be called. So, how do you resolve this? One faster way without using any other external resources is using PHP function debug_backtrace(). Go to “drupal_set_message”, because you know, this is the method that is printing the warning. Put the below line, in that function
Output:
|
Array argument supplied for foreach() in /modules/node/node.module on line 504. |
This function shows the stack of all the functions that are called in the process of causing the warning. Make sure you restrict the limit, otherwise PHP shows a “memory exhausted” message if the stack takes too long to be displayed.
Debugging through CLI:
Heard of phpdbg! Yes, there is a php extension that is available from PHP 5.6+ which is used to debug a php file from command line.
Open you terminal, enter “phpdbg”. This starts an interactive php debugger shell. You can also use breakpoints! Just try it out - the hidden way of debugging PHP.
The only problem is: you will have to get used to the commands of phpdbg to make better use of it.
Debugging through Drupal:
Devel Kint: Drupal developers use this pretty often. Kint is a submodule of the Devel module that can be used to debug Drupal 8 twig templates together with dump();
DB Log: Who is not aware of this Drupal module?! In D7 it is watchdog() and D8 it is logger service.
\Drupal::logger('my_module')->debug($message);
But the only reason why we don’t encourage the use of this module even though we are in love with this is that the log message is written into the database every time!
And imagine if it is a huge database, this would be even worse and will affect the performance. That’s the reason, it is not recommended to use DBLOG module on Production sites.
Do you still want to use DBLog, module and reduce the performance impacts? There is a solution for that as well - DBlog Filter. This is a contributed module which helps in restricting the type of logs to be written into the database. For example, if you want to store only logs of severity “error”, you can configure them with this module. So you don’t have to completely get rid of Dblog module. Oh yes, and this module is contributed by me ;)
Web profiler
Web profiler is a contributed module provided by Devel again. Once you have the module enabled, you will see a report at the bottom of the window. Whenever a page is loaded, this report gives us the page load time, number of queries running in the page, number of forms, number of js/css files, etc. in that page.
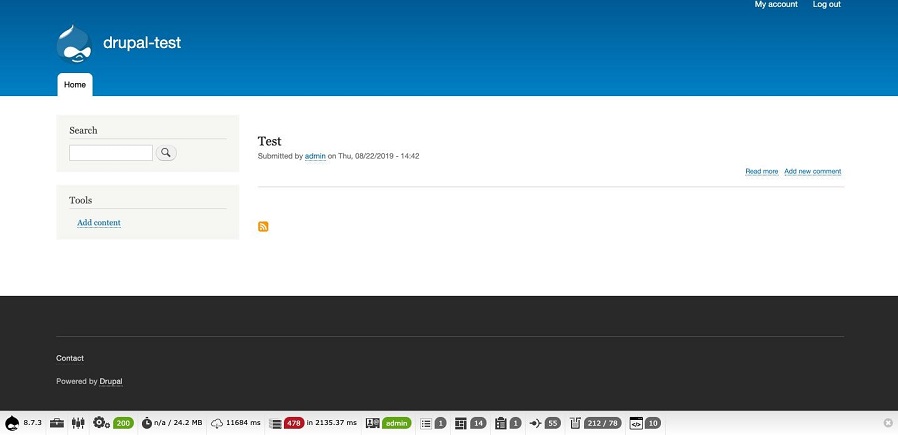
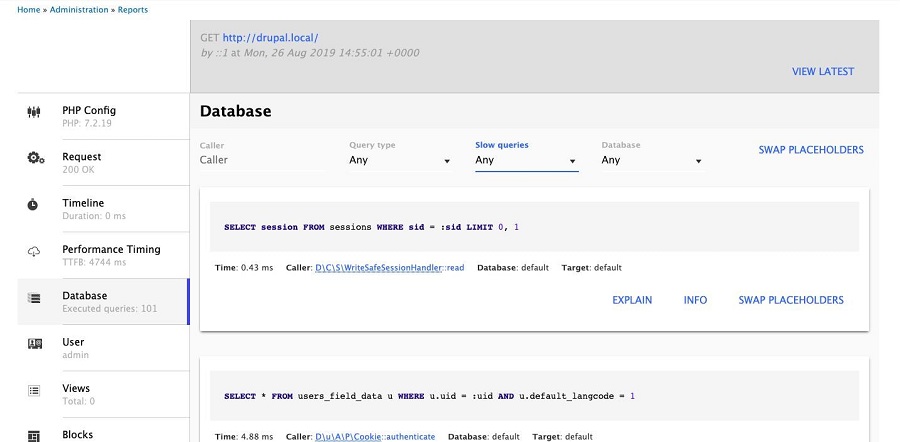
Yes, This even offers details of each section by clicking on them. For example, the following image shows the queries in the home page.
XDebug - Debugging through IDE:
The best and more user-friendly way of debugging most of the people prefer if they are using an IDE for coding is using XDebug. XDebug is a PHP extension that helps in the development and debugging and provides a single step debugger that you can use with an IDE like PHPStorm. Of course to get the best results, you have to put more effort to install and configure the extension with the IDE you are using.
Debugging your PHP code does not always have to be a frustrating experience. With the right tools and methods available today, debugging code can be simplified and gratifying. If you have found my methods of php debugging useful, bookmark us :). And don’t forget to check back on our blogs that get updated with fresh and insightful content every week!
Are you looking for a proven Drupal development company to help you build compelling web experiences? Contact us now!

Harika
Related Insights


Don't Miss Out!